

CS2 Pets Guide: How to Get and Hatch a Chicken Egg
Learn how to get a Chicken Egg in CS2, how pets hatch and grow, all discovered chicken breeds, Pet Book features and current drop details.
October 1, 202607:54 AM10 min

 CS2
CCT SA 2026 Series #7

BORRACHEIROS

RED Canids Academy
Winio Prediction
Before draft
1 of 2 correct
Our predictions vs actual result
49 factors analysed · key ones shown
Winio prediction
RED Canids Academy to win
Average roster strength
14311486Form over 10 matches
80%90%Time with current roster
16 days11 daysStrongest player
14701611Last five matches and head-to-head over a year.
Our rating for every player, powered by the Winio algorithm
player form over the last 10 maps, regardless of team
Prediction: 2 maps
49.9%Round 1 (1st half)
49.0%Prediction: RED Canids Academy
51.0%Round 13 (2nd half)
48.4%Prediction: RED Canids Academy
51.6%Explore a detailed breakdown of the BORRACHEIROS vs RED Canids Academy match at CCT SA 2026 Series #7. Winio's analytical model processed every phase of the game, identified the decisive factors, and measured how closely the pre-match prediction matched the actual result.
Use finished match data to understand how Winio's model performs over time. Each completed match adds to the prediction history available at the Ended Matches section.
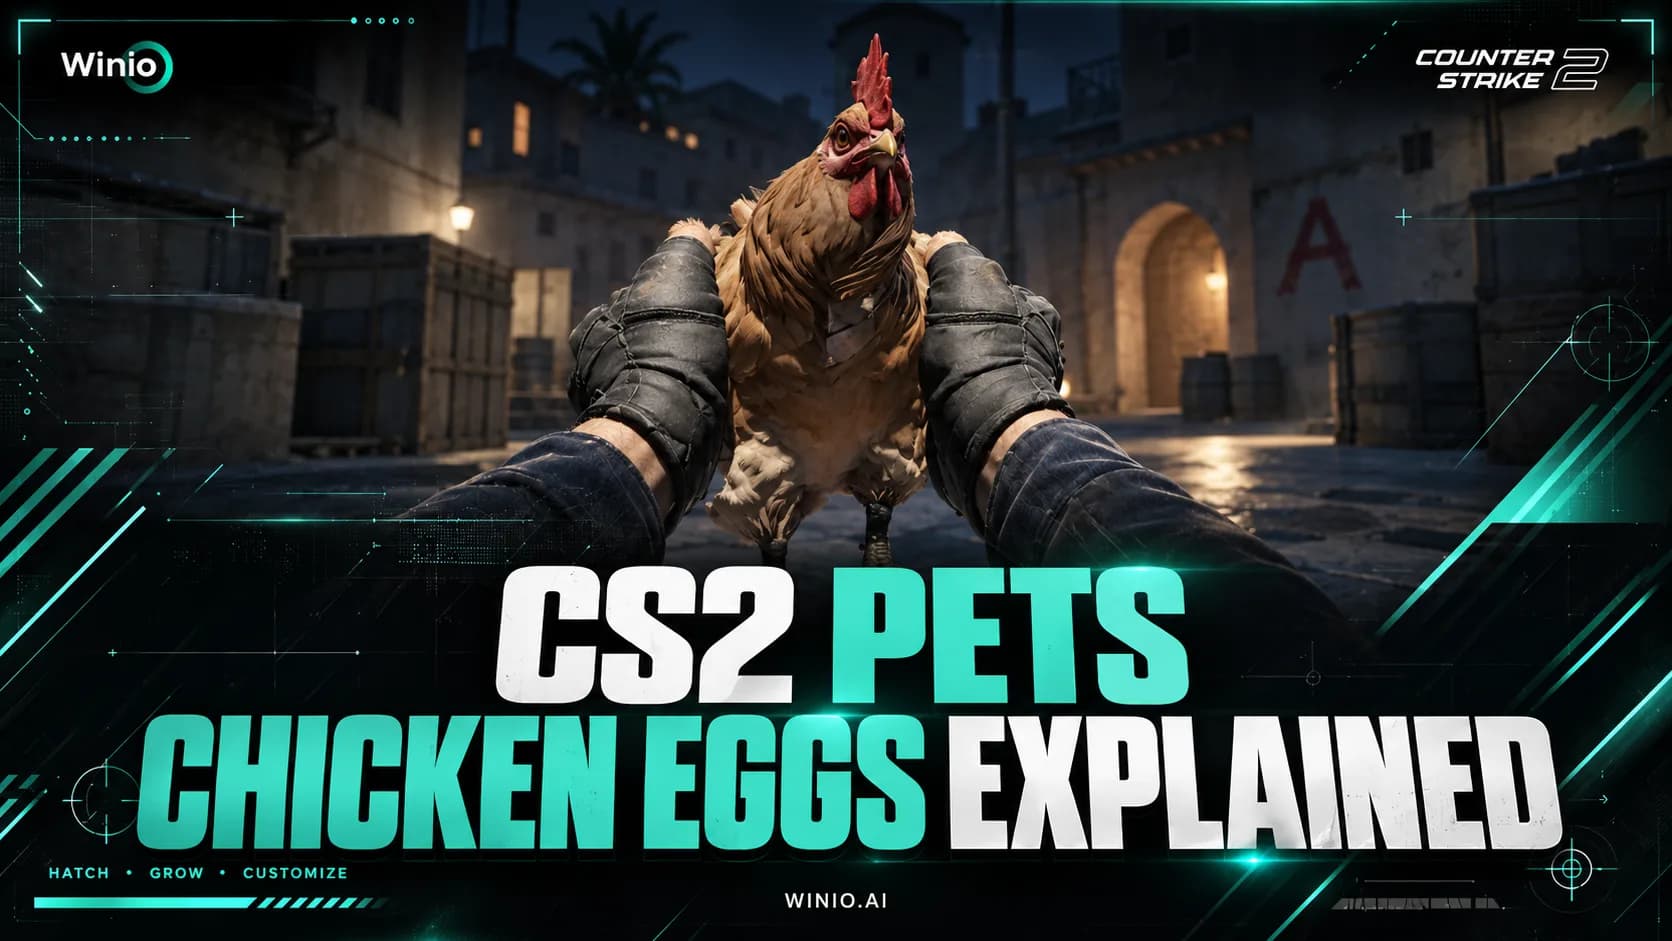
Learn how to get a Chicken Egg in CS2, how pets hatch and grow, all discovered chicken breeds, Pet Book features and current drop details.

Valve released the major CS2 «Rush Hour» update with a new 3v3 mode, Premier map selection changes, silent reloads and crosshair upgrades.

Vitality defeated Aurora 3-1 to win StarLadder StarSeries Fall 2026. Final standings, ZywOo MVP statistics and detailed tournament analysis.