

BLAST Open Porto 2026 CS2: Schedule, Teams and Format
BLAST Open Porto 2026 runs from August 26 to September 6. See the CS2 schedule, groups, format, prize pool, map pool and Winio Power Ranking.
August 23, 202604:05 AM10 min

 CS2
CS2NODWIN Clutch Series #11

Butterfly

Black Phoenix
Winio Prediction
Before draft
Prediction: 2 maps
26.4%Round 1 (1st half)
43.1%Prediction: Black Phoenix
56.9%Round 13 (2nd half)
47.6%Prediction: Black Phoenix
52.4%| Player | K | D | A | ADR | KAST% | HS | FK | FK± |
|---|---|---|---|---|---|---|---|---|
| Butterfly (W) | ||||||||
| 21 | 13 | 4 | 86.9 | 78.3% | 11 | - | - | |
| 19 | 15 | 2 | 84.2 | 65.2% | 5 | - | - | |
| 15 | 16 | 10 | 80.1 | 73.9% | 8 | - | - | |
| 12 | 16 | 5 | 58.2 | 69.6% | 9 | - | - | |
| 10 | 20 | 5 | 47.8 | 60.9% | 5 | - | - | |
| Black Phoenix | ||||||||
| 24 | 15 | 7 | 102.1 | 73.9% | 17 | - | - | |
| 20 | 14 | 3 | 80.3 | 78.3% | 8 | - | - | |
| 14 | 15 | 2 | 62.2 | 69.6% | 8 | - | - | |
| 13 | 15 | 7 | 69.3 | 65.2% | 4 | - | - | |
| 9 | 18 | 9 | 66.4 | 56.5% | 5 | - | - | |
| Player | K | D | A | ADR | KAST% | HS | FK | FK± |
|---|---|---|---|---|---|---|---|---|
| Butterfly (W) | ||||||||
| 21 | 12 | 4 | 86.8 | 90% | 12 | - | - | |
| 20 | 8 | 6 | 93.3 | 90% | 3 | - | - | |
| 13 | 11 | 6 | 69.0 | 85% | 7 | - | - | |
| 13 | 15 | 7 | 85.5 | 70% | 7 | - | - | |
| 10 | 11 | 8 | 72.6 | 80% | 5 | - | - | |
| Black Phoenix | ||||||||
| 14 | 11 | 0 | 57.5 | 75% | 5 | - | - | |
| 13 | 18 | 5 | 79.7 | 75% | 10 | - | - | |
| 13 | 13 | 2 | 58.6 | 70% | 9 | - | - | |
| 11 | 19 | 6 | 70.5 | 80% | 7 | - | - | |
| 6 | 17 | 3 | 43.6 | 60% | 6 | - | - | |
| Player | K | D | A | ADR | KAST% | HS | FK | FK± |
|---|---|---|---|---|---|---|---|---|
| Butterfly (W) | ||||||||
| 18 | 15 | 3 | 77.8 | 68.2% | 9 | - | - | |
| 16 | 15 | 6 | 65.5 | 81.8% | 8 | - | - | |
| 14 | 11 | 5 | 65.6 | 63.6% | 7 | - | - | |
| 13 | 14 | 9 | 72.5 | 81.8% | 6 | - | - | |
| 13 | 15 | 7 | 68.5 | 68.2% | 5 | - | - | |
| Black Phoenix | ||||||||
| 18 | 14 | 5 | 91.9 | 68.2% | 10 | - | - | |
| 16 | 17 | 6 | 78.5 | 72.7% | 8 | - | - | |
| 16 | 14 | 5 | 81.2 | 81.8% | 13 | - | - | |
| 11 | 15 | 6 | 62.0 | 63.6% | 8 | - | - | |
| 9 | 14 | 5 | 36.3 | 63.6% | 1 | - | - | |
No data
No data
Explore a detailed breakdown of the Butterfly vs Black Phoenix match at NODWIN Clutch Series #11. Winio's analytical model processed every phase of the game, identified the decisive factors, and measured how closely the pre-match prediction matched the actual result.
Use finished match data to understand how Winio's model performs over time. Each completed match adds to the prediction history available at the Ended Matches section.

BLAST Open Porto 2026 runs from August 26 to September 6. See the CS2 schedule, groups, format, prize pool, map pool and Winio Power Ranking.
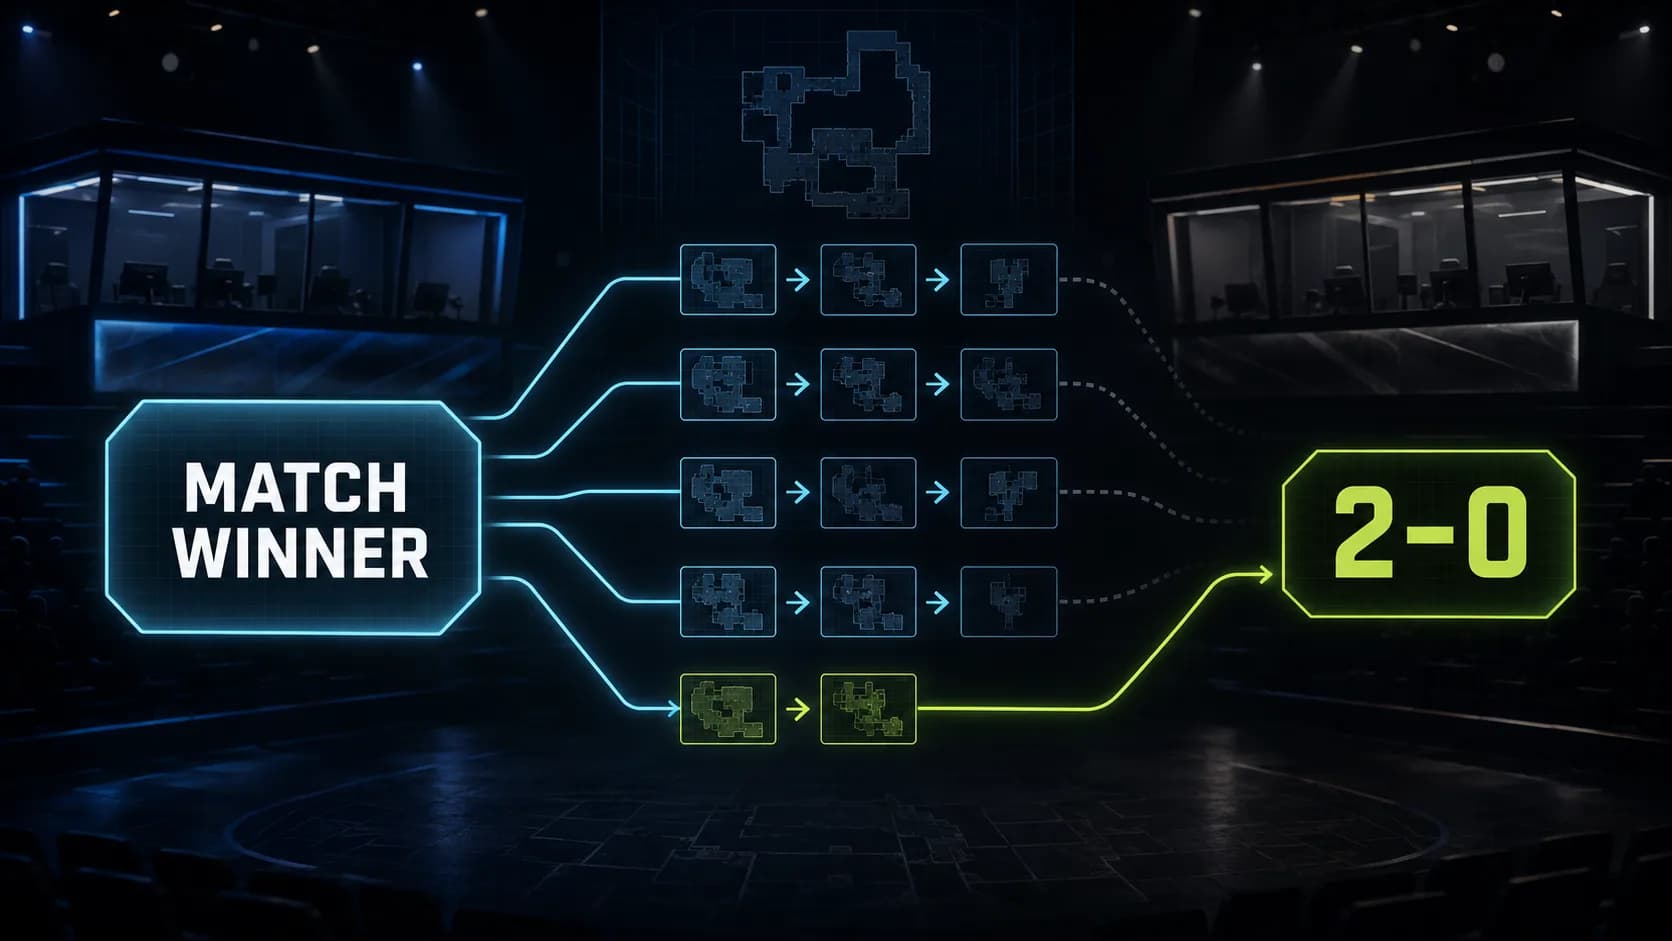
Predicting a 2–0 requires more than identifying the stronger team. Here’s why forecasting a clean sweep in a BO3 is significantly harder than simply picking the match winner.

The Dead Hand Collection brought 17 community-created weapon skins and 22 new glove finishes to CS2. Here’s how the collection works, which items it includes, and how the Terminal mechanics differ from traditional cases.